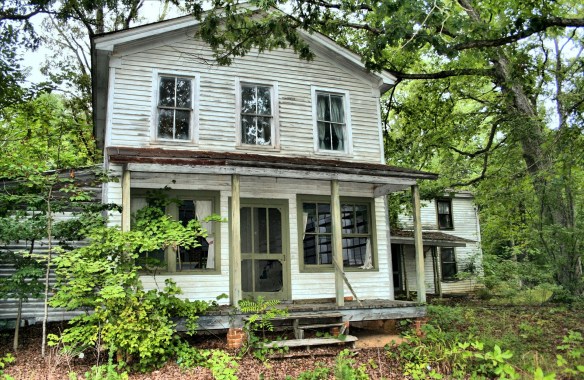
Buck-A-Home

abandoned house

The Saint Louis Post-Dispatch quoted me (from an AP story) in Kansas City Presses To Sell Eyesore, Vacant Homes for A Buck. It reads, in part,

Drawn to the idea of buying a house for just a buck, Dorian Blydenburgh paced through the century-old digs in south Kansas City and didn’t mind tree limbs on the living room floor, holes in the ceiling and a funky mold smell.

“This is one everyone is gonna want, and there’s gonna be a fight for this,” said Blydenburgh, 56, a contractor looking at the three-bedroom, 1,500-square-foot house at 4124 Chestnut Avenue as a makeover prospect for a friend, who later applied to buy it. “Some of these places you need a bulldozer to fix, but this is doable. For a dollar, it looks like a go.”

That’s what Kansas City, Mo., officials were hoping to hear. The city and the Land Bank of Kansas City have offered 130 derelict, generally unlivable structures for sale for $1 each to those willing to make them livable again within a year. The buyer’s reward is an eventual $8,500 rebate — the amount it would have cost the city to flatten the houses.

*     *     *

But it’s buyer beware. Applicants must undergo a background check — applicants who are registered sex offenders or have drug-dealing or prostitution convictions are disqualified — and prove through bank statements or unused credit card limits they have at least $8,500 to devote to the rehab.

Ultimately, the program’s backers warn, rehabbing the properties might cost tens of thousands of dollars, perhaps involving installing or repairing roofs, electrical systems, plumbing, heating and air conditioning or foundations. And that’s beyond the cost of tackling troubling unknowns such as lead or asbestos.

“Most of those buildings on the dangerous list are going to have to come down. We know that,” Mayor Sly James said. “But there are other homes on that low level that could be salvaged, and we want people to know they are out there.”

Other cities have tried similar approaches. In Detroit, with the help of tens of millions of dollars from taxpayers, the city has torn down about 7,100 of an estimated 30,000 to 40,000 vacant houses since May 2014, with the mayor planning to have an additional 15,000 homes gone by 2018. More than 1,300 other homes have been auctioned, Detroit Land Bank Authority spokesman Craig Fahle said. Buyers of those properties, many fetching just the opening bid of $1,000, are required to bring the house up to code and have it occupied within six months — nine months if it’s in a historic district.

Chicago and Milwaukee have are unloading vacant lots. Chicago has sold more than 400 vacant parcels since 2014. In Milwaukee, homeowners next to a vacant lot can buy it for $1.

David Reiss, a Brooklyn Law School professor who focuses on real estate issues and community development, urges would-be buyers to understand the expenses beyond the price tag, including property taxes, upkeep and liability insurance.

“A house for a dollar may be an albatross around your neck,” he said. “I would look at it case by case. If it sounds too good, it probably is.”

Tag

Racial & Ethnic Change in NYC

Brooklyn's poet, Walt Whitman

Brooklyn’s poet, Walt Whitman

Michael Bader and Siri Warkentien have posted an interesting mapping tool, Neighborhood Racial & Ethnic Change Trajectories, 1970-2010. They had set out to answer the question:

how have neighborhoods changed since the Civil Rights Movement outlawed discriminatory housing? We study how neighborhood racial integration has changed during the four decades after the legislative successes of the Civil Rights Movement. We were unsatisfied with previous studies that focused mostly on defining “integrated” and “segregated” neighborhoods based on only on whether groups were present. We thought that the most interesting and important changes occur within “integrated” neighborhoods, and we set out to identify the common patterns of those changes.

We used a sophisticated statistical method to identify the most common types of change among Blacks, Latinos, Asians and Whites in the metropolitan neighborhoods of the four largest cities in the U.S.: New York, Los Angeles, Chicago, and Houston. We were disappointed to learn that many integrated neighborhoods were actually experiencing slow, but steady resegregation — a process that we call “gradual succession.” The process tended to concentrate Blacks into small areas of cities and inner-ring suburbs while scattering many Latinos and Asians into segregating neighborhoods throughout the metropolitan area.

While we reserve a healthy dose of pessimism about long-term integration, we also find neighborhoods experiencing long-term integration among Blacks, Latinos, Asians, and Whites. We call these “quadrivial” neighborhoods, which derives from Latin for the intersection of four paths. We thought that seemed appropriate given the often different paths different racial groups took to these neighborhoods. (emphasis in the original)

I was, of course, interested in the New York City map. While NYC is highly segregated, it was interesting to see the prevalence of these so-called quadrivial neighborhoods. The authors find that

About 20 million people call the New York metropolitan area home. The metro area is one of the most segregated in the United States and, as a result, New York has a large proportion of neighborhoods following stable Black and stable White trajectories. Some of the segregation came about because of White flight during the 1970s. Black segregation following this path clusters in the Lower Bronx, North Brooklyn, and in and around Newark, New Jersey.

Large-scale Latino immigration to the New York metro area has been relatively recent, and the number of recent Latino enclaves bears out that pattern. Neighborhoods experiencing recent Latino growth are scattered throughout suburban New Jersey, Long Island and northern New York neighborhoods. New York also experienced high levels of Asian immigration relative to other metropolitan areas. Neighborhoods experiencing recent Asian growth are scattered throughout the metropolitan region.

New York also contains a large number of quadrivial neighborhood and the highest proportion of White re-entry neighborhoods. The latter are found near transportation to Manhattan in the gentrifying areas of Jersey City and Weehawken, New Jersey and the Brooklyn terminals of the Manhattan and Williamsburg Bridges.

New York, therefore, contains the contradiction of containing a large number of segregating neighborhoods along with a distinct trend toward integration.

I am not sure that I have any insight to explain that contradiction, although Walt Whitman, Brooklyn’s poet, notes:

Do I contradict myself?

Very well, then I contradict myself,

(I am large, I contain multitudes).

Economic Factors That Affect Housing Prices

photo by TaxRebate.org.uk

S&P has posted a paper on Economic Factors That Affect Housing Prices. This is, of course, an important topic, albeit one that is an art as well as a science. While S&P undertook this analysis more for mortgage-backed securities investors than for anyone else, it certainly is of use to the rest of us. The paper opens,

The U.S. domestic housing market has experienced a 23% price increase since the beginning of the housing recovery in 2011. Many local housing markets are now close to or above their peak levels of 2006, which leads us to investigate whether the pace of home price appreciation (HPA) can continue at its current pace. In this paper, we (1) examine the economic factors that influence HPA and (2) forecast HPA for numerous geographic regions assuming various economic conditions over the next five years. While the aggregate national pattern in housing prices is an important reference, we need to examine housing prices at a more granular geographic level in order to understand regional housing market dynamics and learn how these are affected by local macroeconomic factors. This paper demonstrates that several economic variables are needed to predict average home price movements for each of 48 different U.S. metropolitan statistical areas (MSAs).

*     *      *

Factors that influence HPA can be difficult to predict. Therefore, residential mortgage backed securities (RMBS) investors frequently use a range of HPA projections to estimate their potential bond returns. With that in mind, for each MSA, we considered five separate hypothetical economic scenarios, ranging from an “Upside” forecast to an extreme “Stress 3” case. Interestingly, our Stress 3 case forecasts a 28% decline in HPI at the national level over the next five years, which corresponds roughly to the decline experienced in the last recession. Our “base case” scenario leads to forecasts at the national level of a 26% increase in HPI over five years. This represents what we believe to be the most likely economic forecast. (1-2)

S&P’s key findings include:

  • Movement in HPA is primarily influenced by up to five variables, depending on the MSA: housing affordability, changes in shadow inventory, the unemployment rate, the TED spread [a measure of distress in the credit markets], and population growth.
  • HPA in many MSAs has momentum, meaning that it depends on its level in the previous quarter of observation.
  • The mortgage rate generally appears to have little predictive power in connection with home prices.
  • Chicago, Houston, Boston, and San Francisco are projected to appreciate at a greater pace (45%, 40%, 27%, and 36%, respectively) than the 26% forecast for the nation as a whole over the next five years, and New York at a slower pace (21%). Columbus led all MSAs with a projected five-year HPA of 50%.
  • Under our most pessimistic (Stress 3) scenario, Chicago is forecast to experience a greater decline in HPI (34%) over the next five years than the nation as a whole (29%), while New York, Boston, Houston, and San Francisco are projected to experience declines that are less severe than that of the nation (19%, 3%, 17%, and 16%, respectively). Markets that have been vulnerable in the past (Las Vegas, Phoenix, and Riverside) are projected to experience the greatest five-year declines under our Stress 3 scenario (66%, 68%, and 68%). The markets that show the greatest movements are the most sensitive to the five factors and frequently show the greatest upside and downside. (2-3, emphasis in the original)

I found the first and third bullet points to be the most interesting, as many pundits weigh in on the factors that affect housing prices. It will be interesting to see if further research confirms S&P’s findings.

Best Time to Sign a Lease

photo by Beth Kanter

The Allstate Blog quoted me in What’s the Best Time of Year to Sign a Lease? It opens,

There is no way around it — apartment hunting can be stressful. And the cost of rent can be quite expensive — even outpacing average U.S. salary increases. According to the National Association of Realtors, the cost of rent rose an average of 15 percent while renters’ income only rose 11 percent from 2009 to 2014. However with some planning and negotiating, you may be able to have some more money in your pocket at the end of each month.

Similar to how you can pay more for a winter jacket in October than May, rental rates often vary throughout the year. By planning your move and signing lease terms to help position your next move during the lower rental rate season, you may end up saving some money. 

Research the Demand in Your Area

Just like most things, supply and demand determines prices in the rental market. Not surprisingly, you may get a better deal on renting when demand for condos or apartments are at their lowest. However, if you live in a tight rental market, your choices could be very limited. “In most areas the slow rental season is typically late fall through winter since less people move during this time,” says Scot J. Haislip, vice president, national lease program at the National Apartment Association (NAA).

It is important to understand the rental market you’re looking to move into since rental patterns can vary based on where you live. David Reiss, director of Community Development Clinic in New York City and professor at Brooklyn Law School, specializing in real estate and community development recommends contacting several local brokers to get their perspective on the slower rental periods in your area of interest. He also cautions that some high demand areas, such as New York City or Chicago, currently do not have a slower period for rentals.

Smart Negotiation

Even during the winter months, most landlords are not going to simply hand over a discount — you have to work for it by negotiating with your prospective landlord. Before you broach the subject of price, do your homework by picking up the phone or researching online to compare similar units at the current time. Reiss suggests that you consider asking for a decrease in your monthly rent or a period of free rent.

Thursday’s Advocacy & Think Tank Round-Up

  • The Institute of Housing Studies at DePaul University has issued a report analyzing foreclosure activity which finds that foreclosures are down in the Chicago area in 2014.  The report also finds that mortgage activity remains low while investor buyers have become a major factor in the single family market.
  • Miami Coalition for the Homeless has proposed a set of solutions to make housing in Miami affordable.  The prosed policy changes grew out of a cross sector symposium dubbed the 2015 Housing Summit – organized to promoting the creation and maintenance of affordable housing in Miami-Dade County, where 71% of monthly household income goes to housing and transportation.
  • The National Association of Realtors (NAR) would like to see the Federal Housing Authority (FHA)  increase National Loan Limits.  The National Loan Limit sets the individual loan limits available under the Government Sponsored Entities (Fannie and Freddie) and FHA and VA loan programs. In a comment letter to the FHA NAR argues that since housing prices have rebounded following the financial crisis – now expected  to surpass 2007’s prices, increases are in order.

The Housing/Income Affordability Gap

We need affordable housing

The Urban Institute has issued a policy brief, The Housing Affordability Gap for Extremely Low-Income Renters in 2013. The brief opens,

Since 2000, rents have risen while the number of renters who need low-priced housing has increased. These two pressures make finding affordable housing even tougher for very poor households in America. Nationwide, only 28 adequate and affordable units are available for every 100 renter households with incomes at or below 30 percent of the area median income. Not a single county in the United States has enough affordable housing for all its extremely low-income (ELI) renters. The number of affordable rental homes for every 100 ELI renters ranges from 7 in Osceola County, Florida, to 76 in Worcester County, Maryland.

*     *     *

This brief is the first publication on housing affordability to combine detailed county-level data on ELI renter households (those with incomes at or below 30 percent of the area median) and the impact of US Department of Housing and Urban Development (HUD) rental assistance. Its four key findings:

  • Supply is not keeping up with demand. Between 2000 and 2013, the number of ELI renter households increased 38 percent, from 8.2 million to 11.3 million. At the same time, the supply of adequate, affordable, and available rental homes for these households increased only 7 percent, from 3.0 million to 3.2 million.
  • The gap between ELI renter households and suitable units is widening over time. From 2000 to 2013, the number of adequate, affordable, and available rental units for every 100 ELI renter households nationwide declined from 37 to 28.
  • Extremely low-income renters increasingly depend on HUD programs for housing. More than 80 percent of adequate, affordable, and available homes for ELI renter households are HUD-assisted, up from 57 percent in 2000.
  • The supply of adequate, affordable, and available units varies widely across the country. Among the 100 largest US counties, Suffolk County, which includes Boston, comes closest to meeting its area’s need, with 51 units per 100 ELI renter households.Denton County, part of the Dallas-Ft. Worth metropolitan area, has the largest housing gap,with only 8 units per 100 ELI renters. Rust Belt areas (e.g., Detroit, MI; Chicago,IL, and Milwaukee, WI) have seen large declines in adequate, affordable, and available units. Most counties had fewer units available in 2013 than 2000. Notable exceptions to this trend include Suffolk, MA; Los Angeles, CA; and Miami, FL, which have expanded their number of available units since 2000. (1-2, footnote omitted)

The brief concludes, “Simply put, virtually no affordable housing units would be available to ELI households absent the continued investment in federally assisted rental housing.” (14)

This is an affordable housing story, but it is just as much an income story — low-income households are getting left behind in the race between rising income and expenses. One solution is to expand housing assistance for low-income families. Another is to increase income, one way or another. The bottom line, though, is that low-income households don’t have enough to make a go of it in these United States.